Detections, events and observations
These three words appear all over the app and they mean different things.
Detection
One box around one animal, in one file. A photo with three deer has three detections. Each detection has a species label and a confidence score. It is the smallest unit, and it is what you correct on the Labels page.
Videos
AddaxAI takes several frames out of every clip and checks those, not the whole video. So one clip holds many detections, and the species can change from one checked frame to the next. One raccoon walking through a clip was read as raccoon, badger, badger, blank and opossum on five frames in a row. These guesses are noisy. This is normal.
AddaxAI picks one frame per video and uses only that one. It is the frame where the AI is most sure it saw something. That frame decides the species, the count, the picture in the grid, and the folder the video is copied into.
You only see the other frames when you play the clip. The boxes and labels there belong to the frame on screen, so they change while it plays. Your correction stays on the frame that counts, even when older guesses still flash past.
Nothing is thrown away. The Detections export still has one row per box, on every frame that was checked. The Files export has one row per video, describing the single frame that stands for it.
Event
Files from the same camera, taken close together in time. AddaxAI groups them for you. So if a deer walks past and the camera fires 12 times in one minute, that is one event, not 12.
A deployment with paired cameras is one camera for this purpose.
The gap that starts a new event is the independence interval, 30 minutes by default. That gap is measured from one photo to the next, not from the start of the event. So a photo joins the event when it comes within 30 minutes of the previous photo, and only a longer gap starts a new one. An event has no fixed length: it can run for hours if the camera keeps triggering.
Both modes group files into events. A folder run uses them behind the scenes, to smooth labels and to order the grid on the Labels page. Only a project turns them into counts you can confirm.
Observation
One species inside one event, with a count. If an event holds 8 photos of deer and 2 of a fox, that is one event with two observations: deer and fox. If each photo shows a single animal, both counts are 1, not 8 and 2. On the Counts page you can split one species into groups, for example adults and juveniles, each with its own count. Each group is then its own observation.
How the count is worked out
The count starts as a suggestion from the AI, not a final number. It takes the highest number of that species visible in any single photo of the event, often called MaxN. An example: a deer walks past and the camera takes 5 photos.
| Photo | Deer visible |
|---|---|
| 1 | 1 |
| 2 | 2 |
| 3 | 2 |
| 4 | 1 |
| 5 | 0 |
So the suggestion is 2, not 6. Two deer were there, and counting every photo would count the same animal again.
On the Counts page you confirm that number or change it. Your number then replaces the suggestion everywhere: in the charts, the rates and the exports. See confirm the counts.
The same visit, counted three ways
Say one deer triggers your camera 40 times in an afternoon. That is 40 detections, 1 event, and 1 observation with a count of 1. Same data, three different numbers.
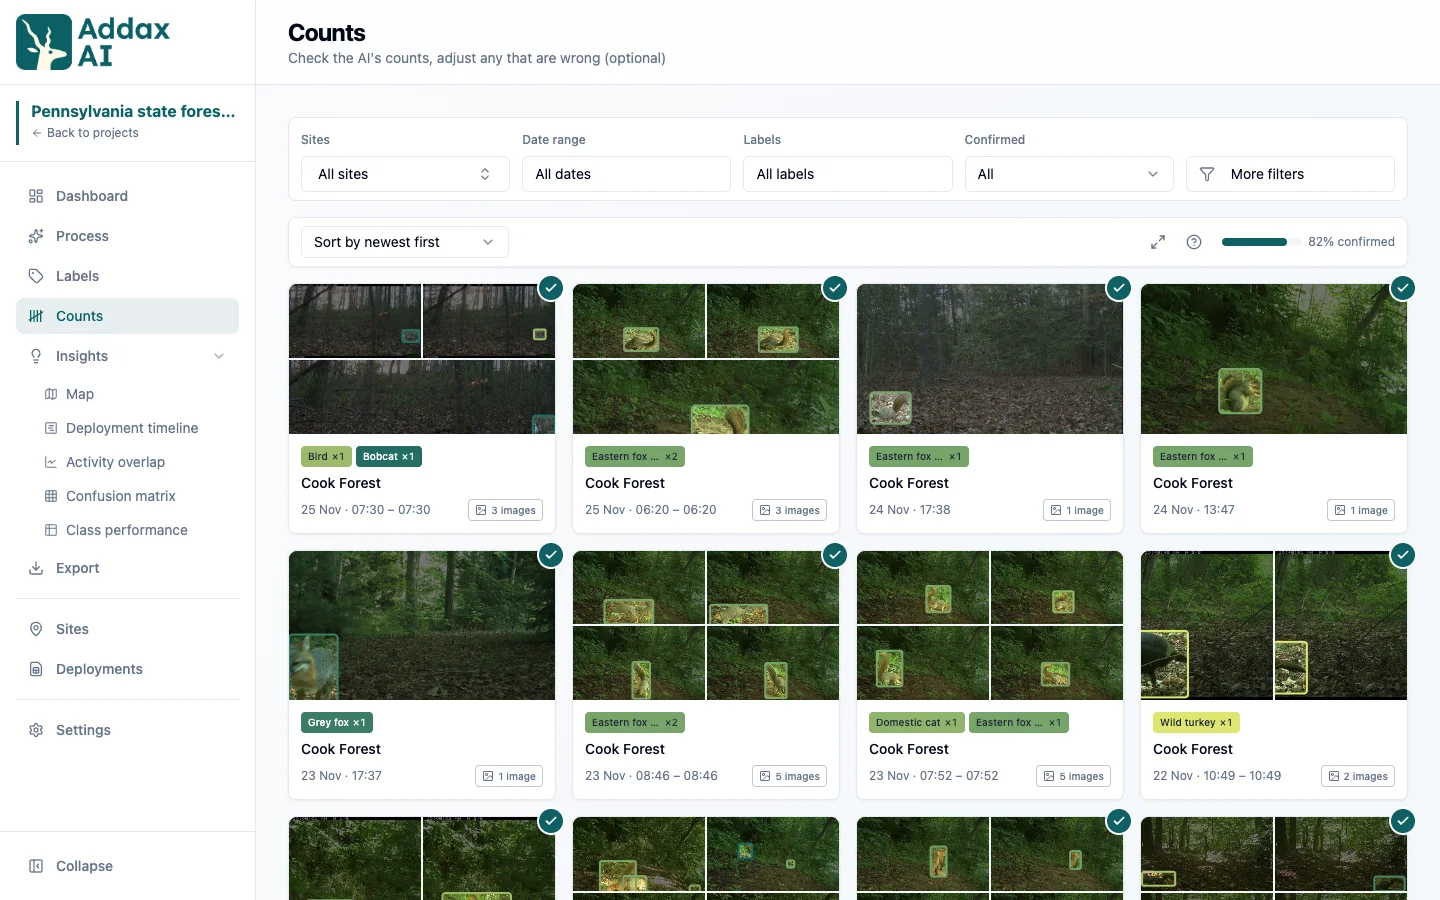
Where each number appears
| Number | Where you see it |
|---|---|
| Detections | Labels page, detections export |
| Events | Counts page, dashboard tile |
| Observations | Dashboard, map, charts, counts export |
Each page works at the level it needs. The Labels page works on detections, because that is what the AI predicts. The Counts page works on events, because an event is one visit, as set by your independence interval. Each event then gives one observation per species, and those observations feed the dashboard, the map, the charts and the exports.