Build a project
A project is a stored workspace where your results become insight: counts, maps, rates and trends. Where a folder run is one-and-done, a project keeps everything: detections, verification history, species counts, and the analyses built on top of them. It is additive, so you keep adding deployments and the dashboards, maps, and stats update with them.
Video tutorial
Prefer to watch? This video walks through building a project, from adding deployments to exploring the results.
Structure
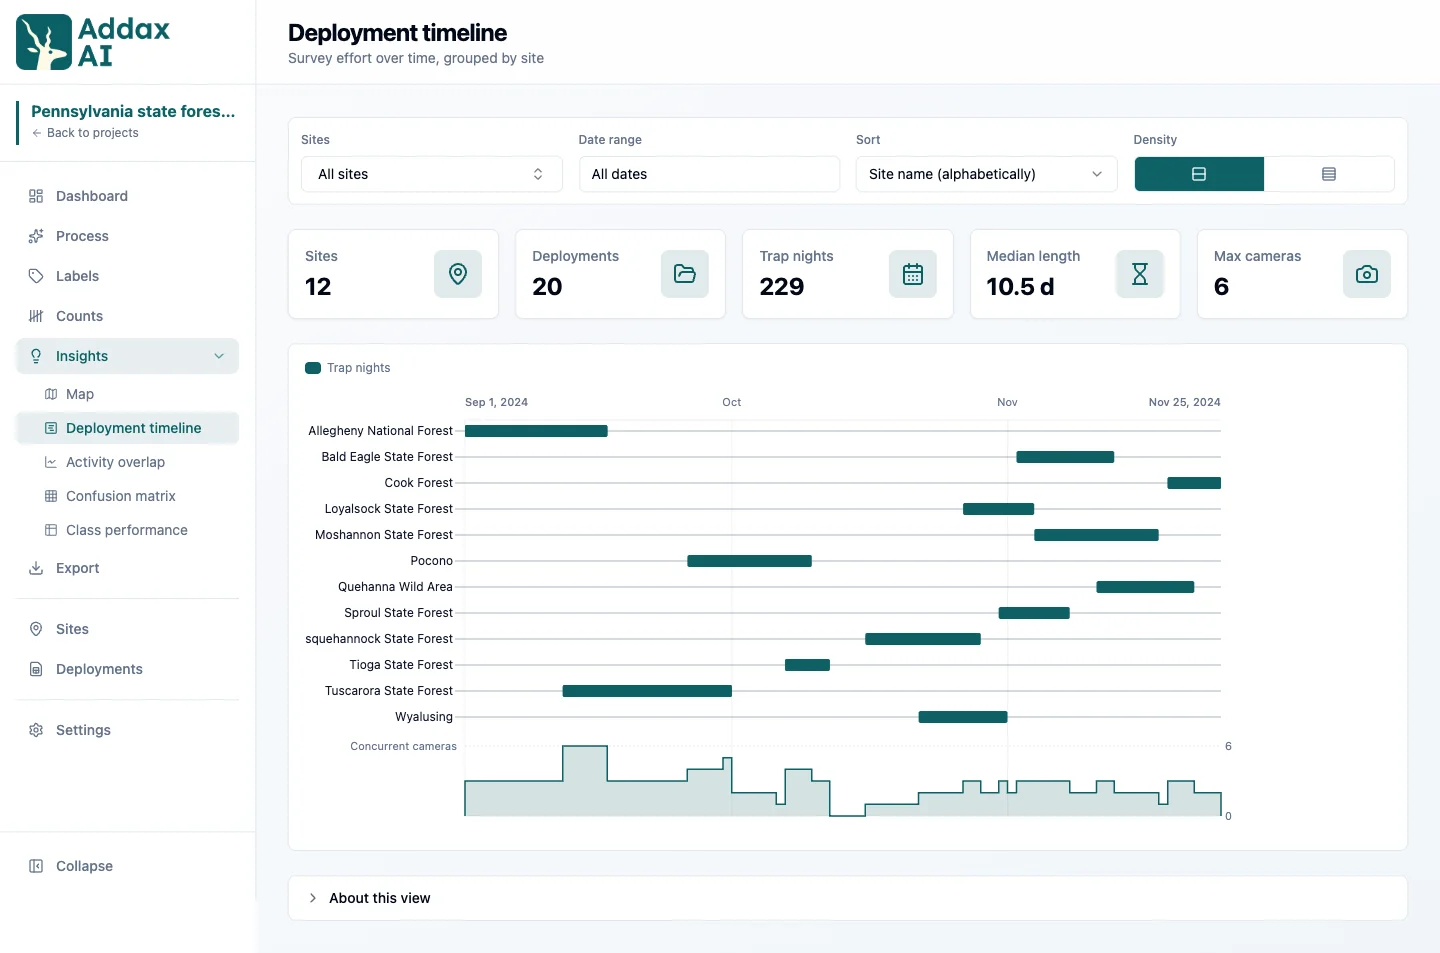
A project organises data in a hierarchy: project, site, deployment, file, detection. See how a project is organised for what each word means, and how many deployments one camera should become.
Add deployments
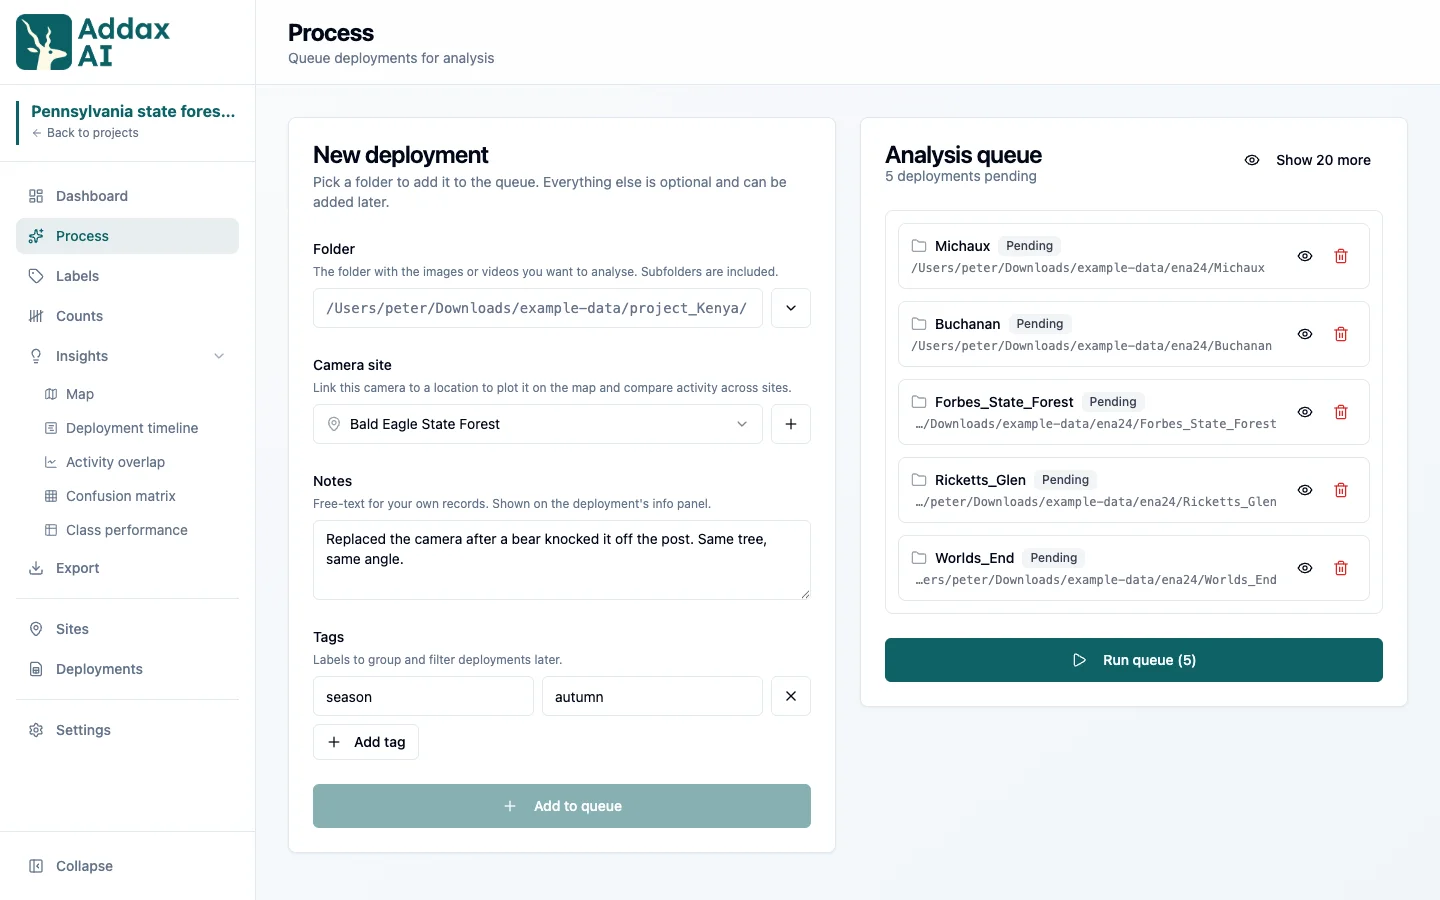
Add each camera period as a deployment and point it at that folder of files. AddaxAI works through them in a queue, one after another. Cameras that trigger on the same animals, for example at both ends of a wildlife bridge, are one deployment, see paired cameras.
Import from a spreadsheet
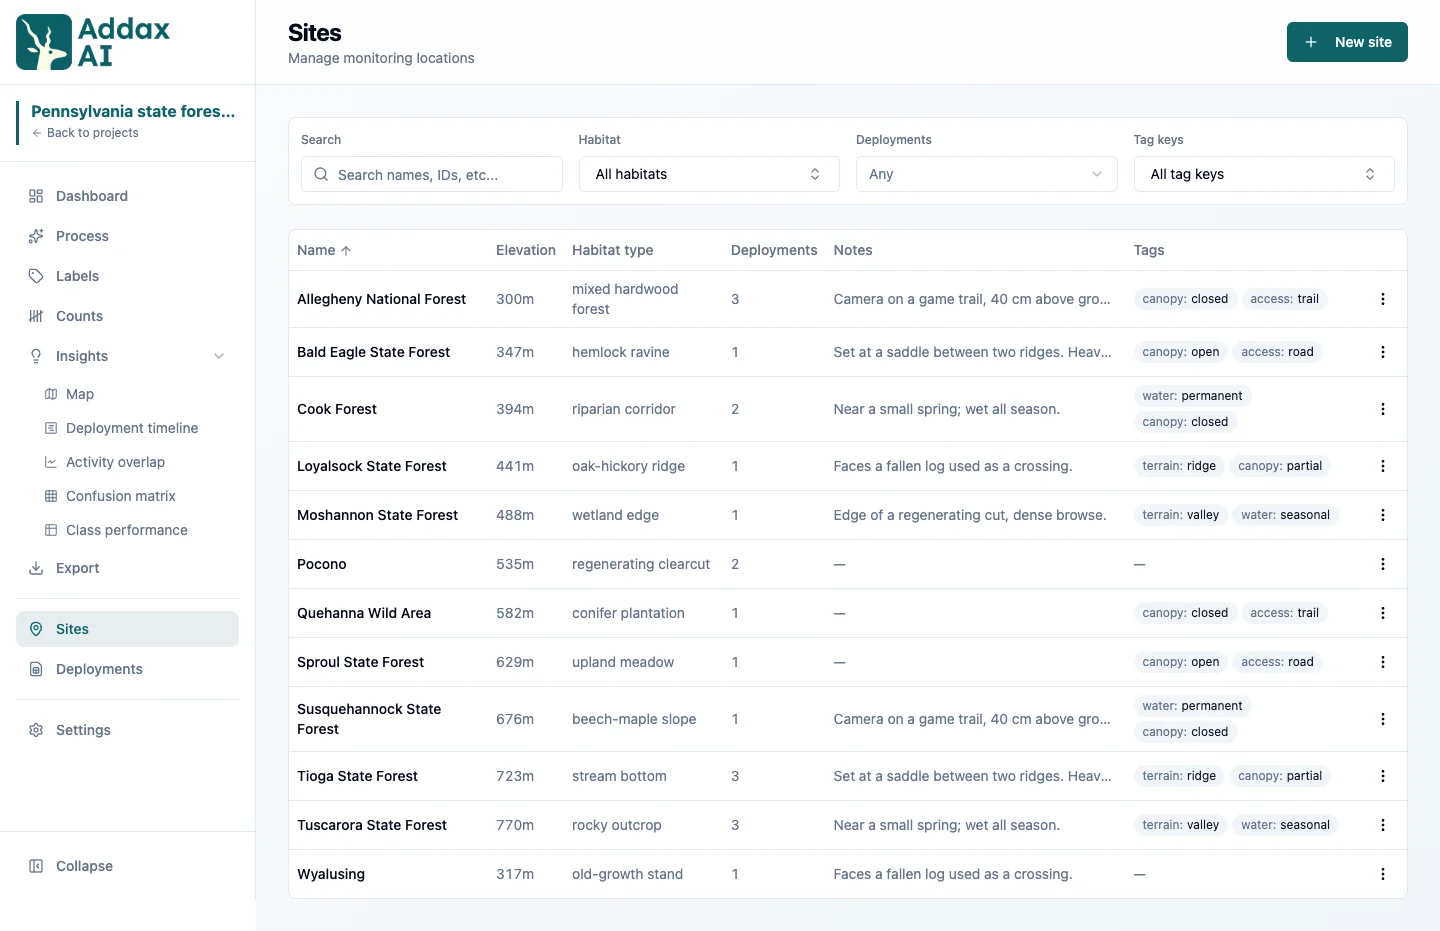
If you already keep your cameras in a spreadsheet, you can add them in one go instead of typing each one. Save it as a CSV file and use "Import from CSV", on the Sites page and on the Process page. Import your sites first, because a deployment refers to a site by its name.
The dialog lists the columns it expects, offers an example file to download, and shows you what would be created before anything is saved.
Tags come along too. Any column whose name starts with tag: is a tag: tag:tenure with the value National park gives the site or deployment a tag tenure: National park. Use one column per tag and leave the cell empty on rows that do not have it. The tags show on the site or deployment and in the exports.
Refine as you go
You don't have to get the structure right the first time. Add your folders and start checking results. Two things add more later:
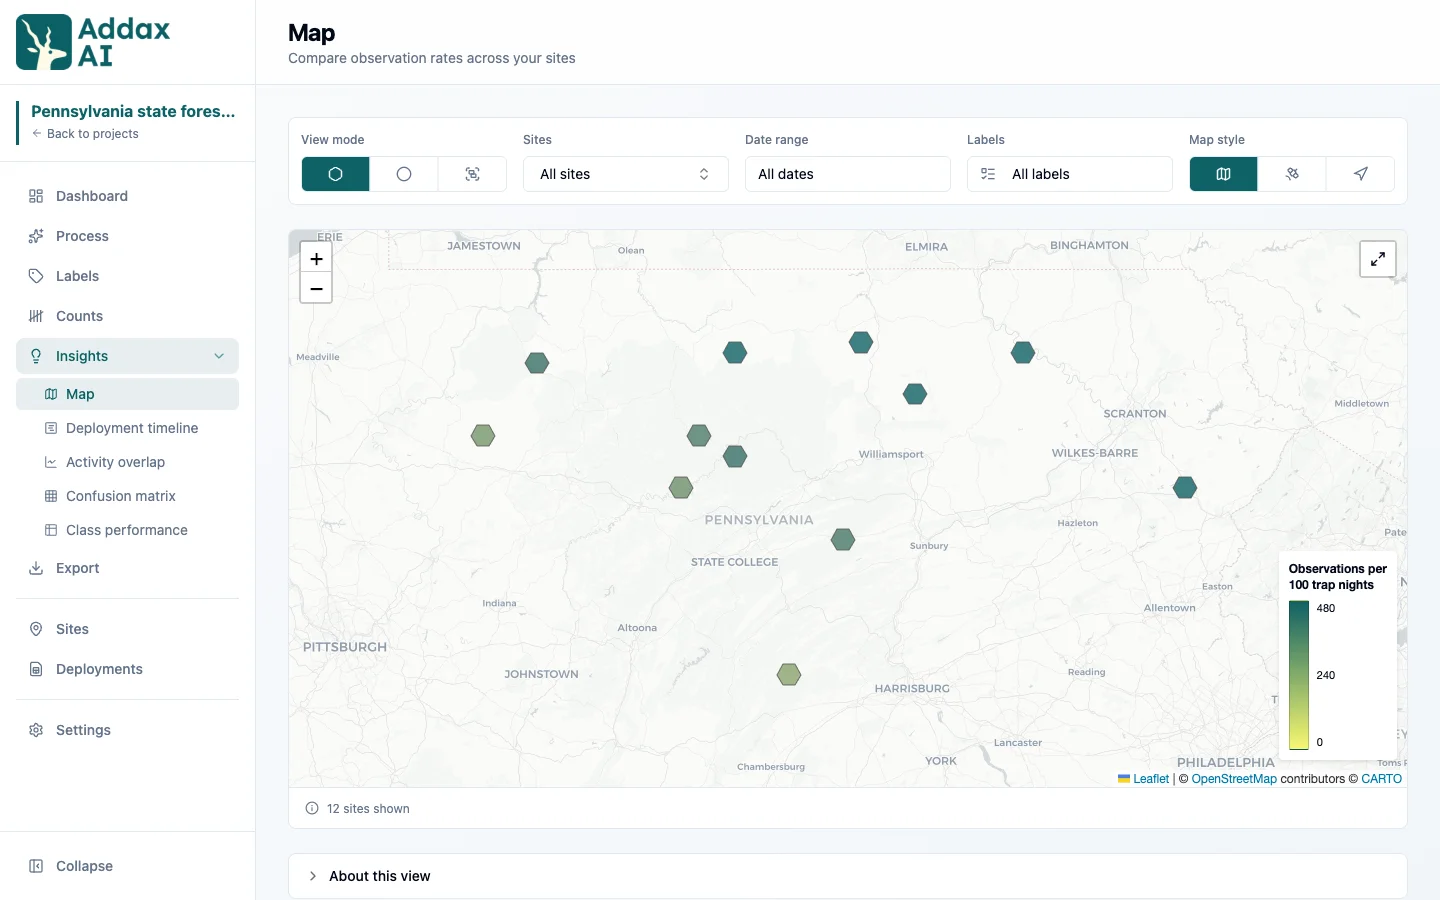
- Give a deployment a site with coordinates, and it shows up on the map.
- Split a folder into separate deployments, one camera period each, for a correct Camtrap DP export.
Do both anytime on the Sites and Deployments pages. AddaxAI reminds you where it matters, like on the map or in an export.
Check the AI labels
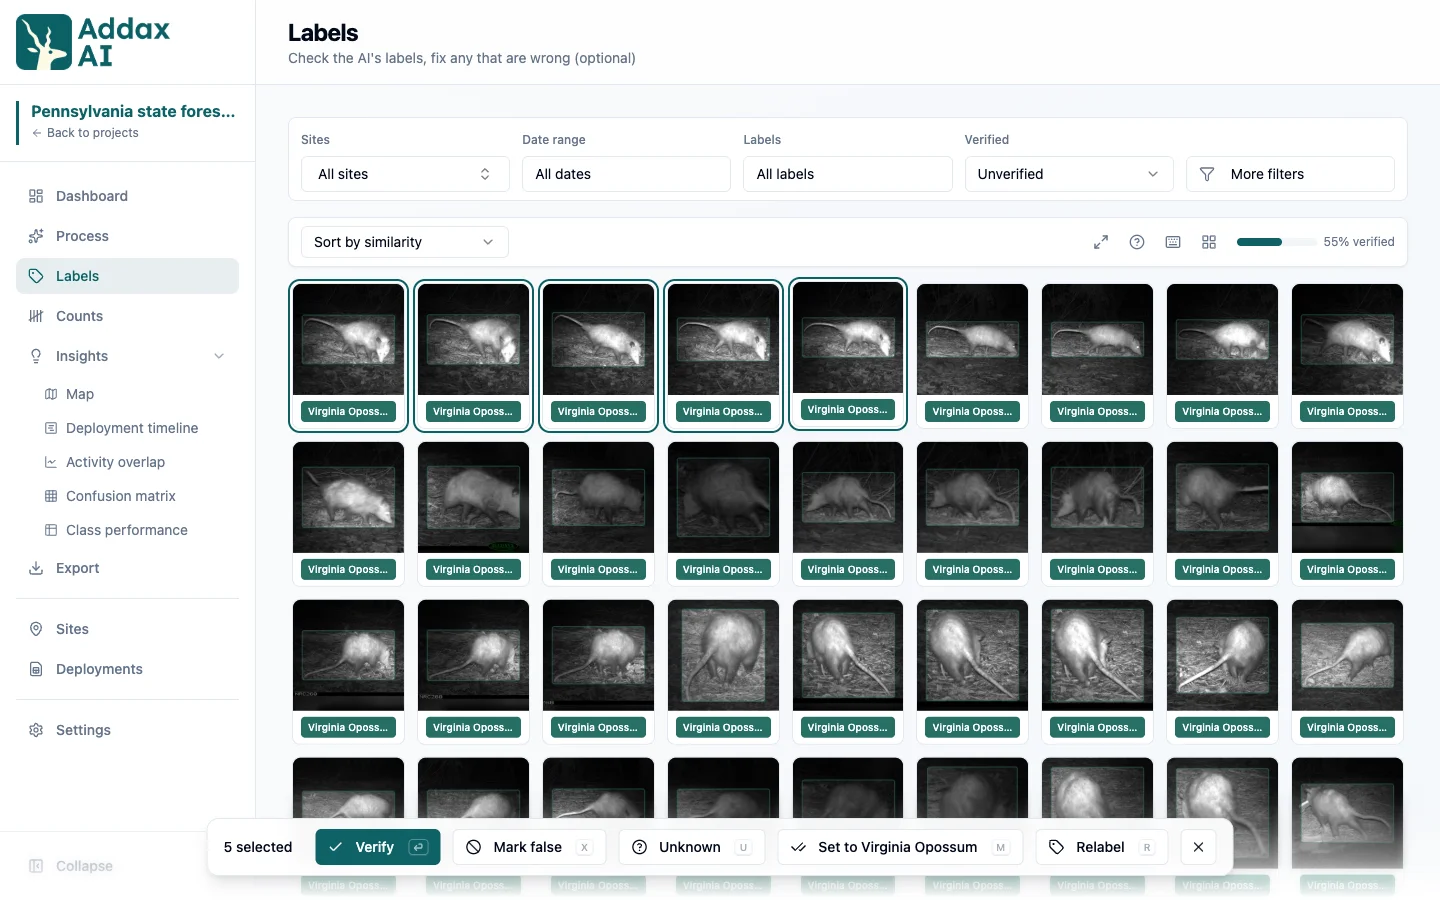
On the Labels page you go through the detections and confirm or correct the species. Human edits always win over the AI and are never overwritten. Similar-looking animals can be grouped and labelled together. See check the labels for how it works.
Confirm the suggested counts
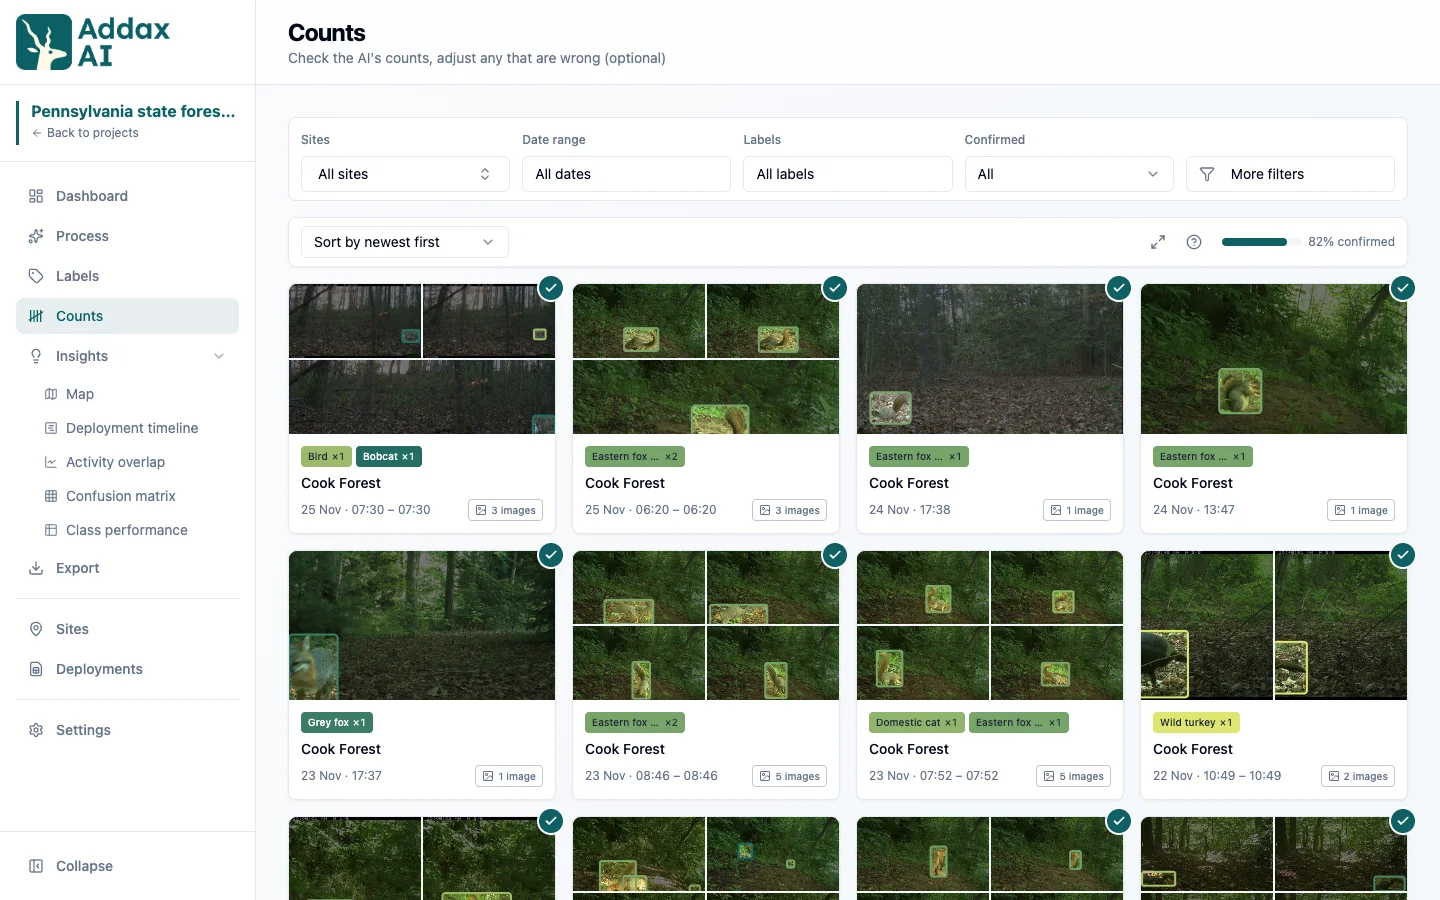
For each event, AddaxAI suggests a count: the most animals seen together in a single photo. On the Counts page you confirm or correct that number, and it feeds the rates and charts. Recommended after the labels. Counting works best once the labels are clean, with less noise to sort through. See confirm the counts for how it works.
Watch the data build up
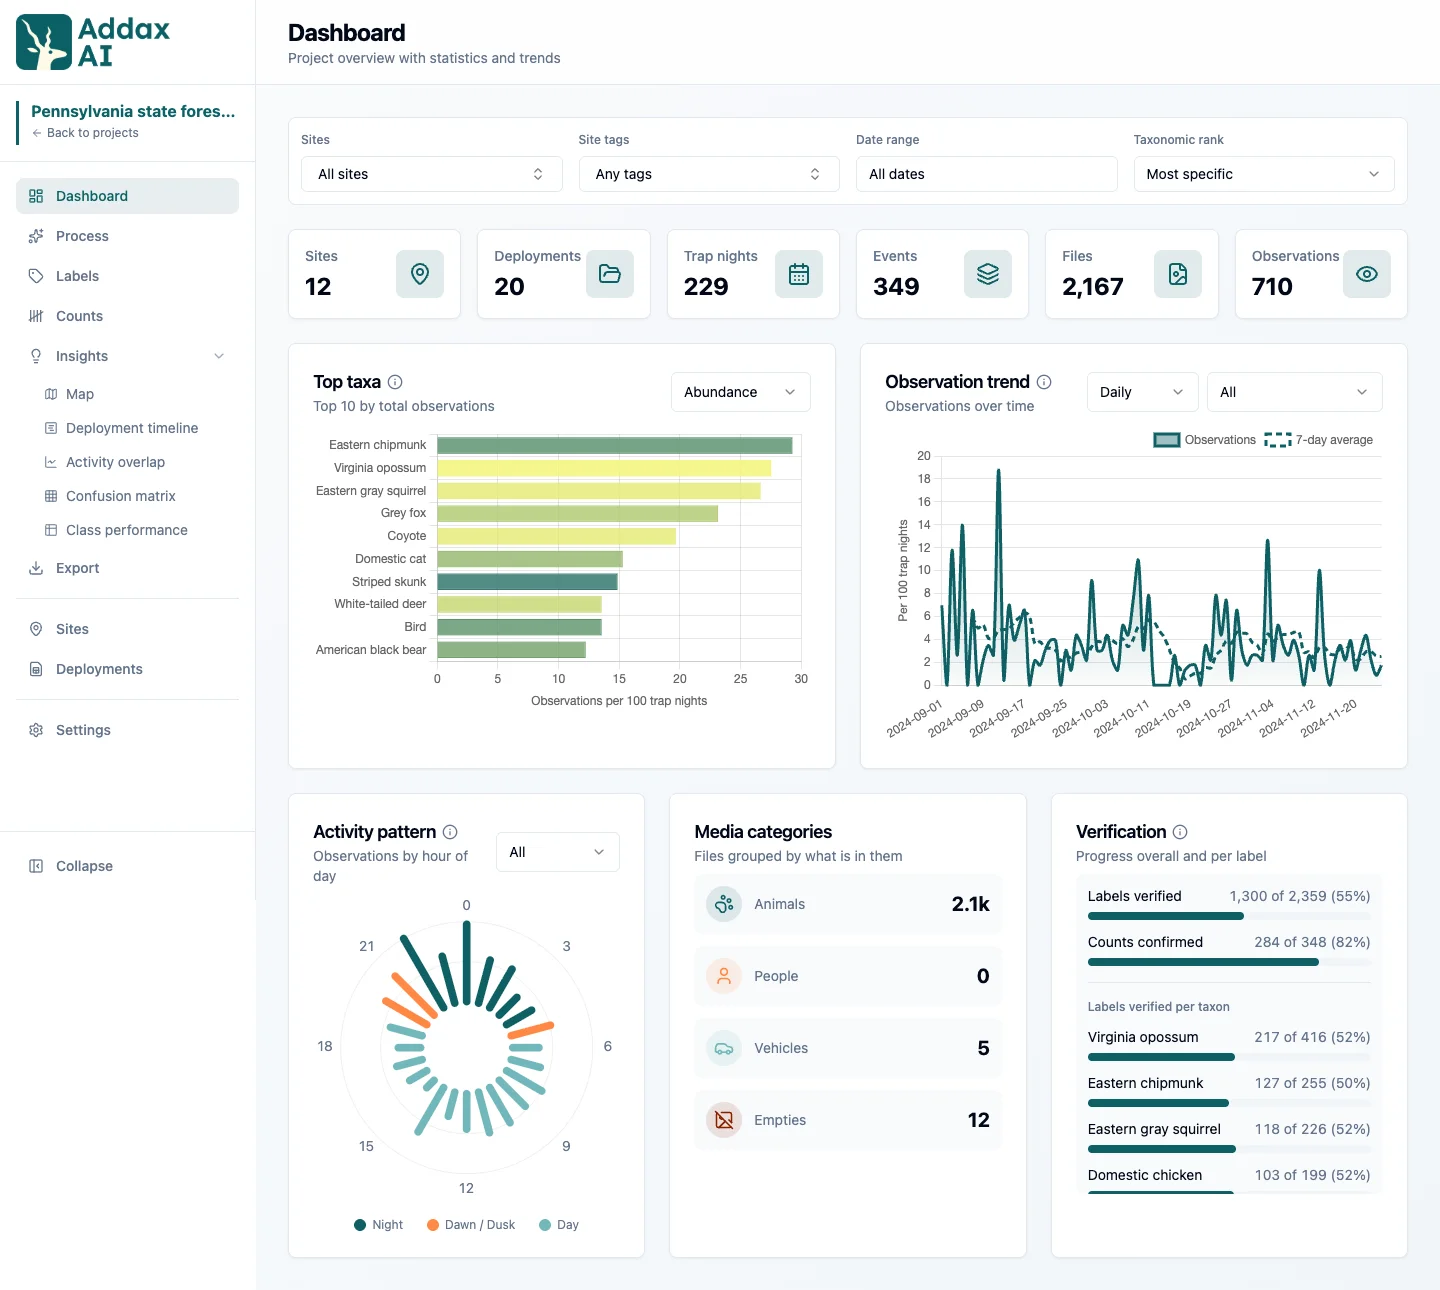
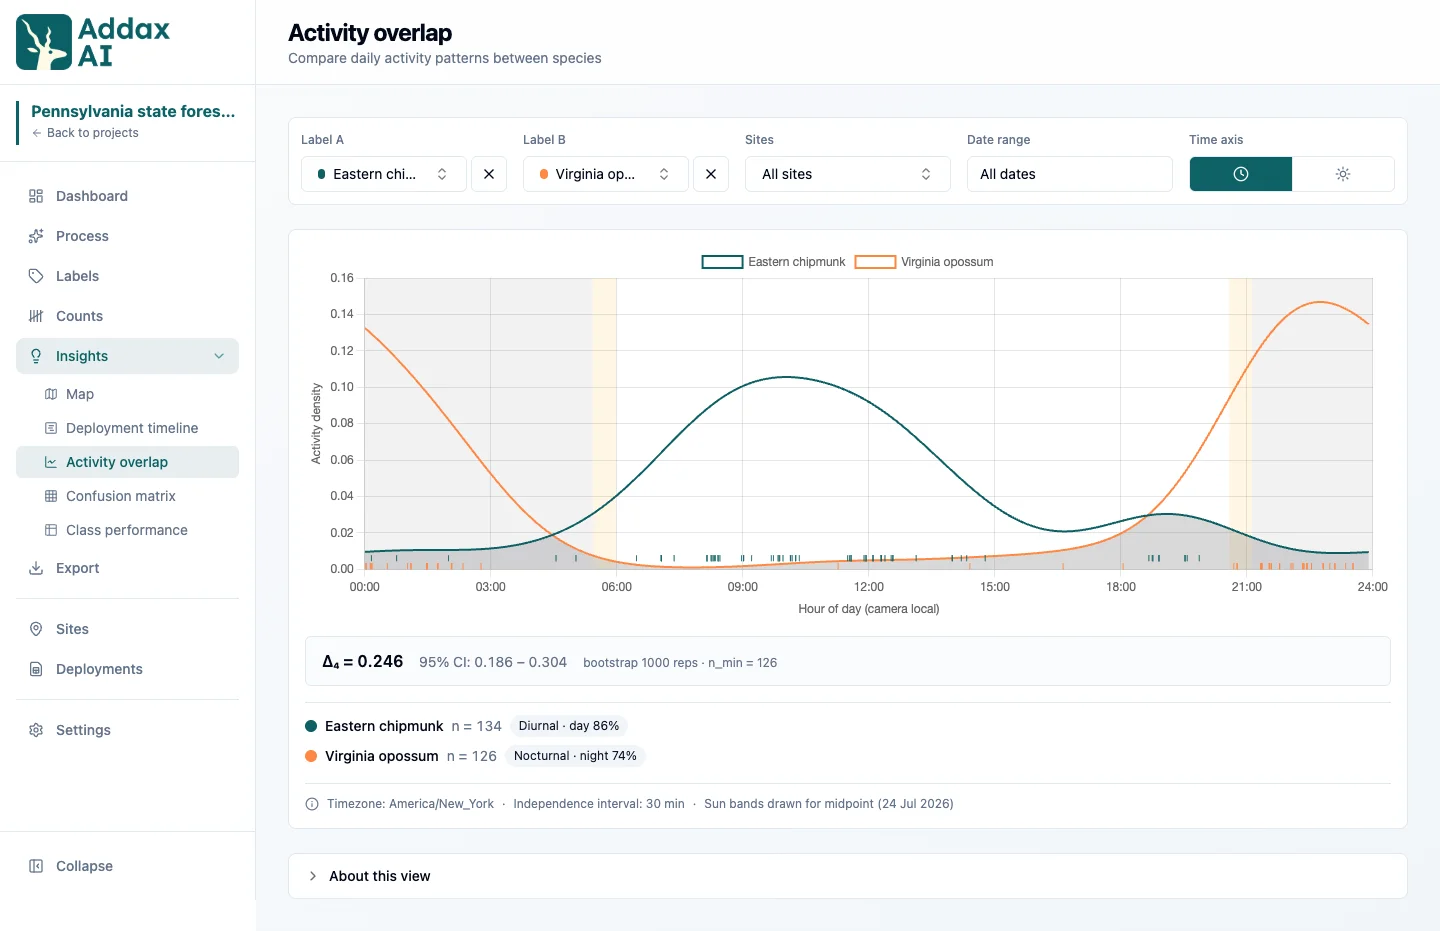
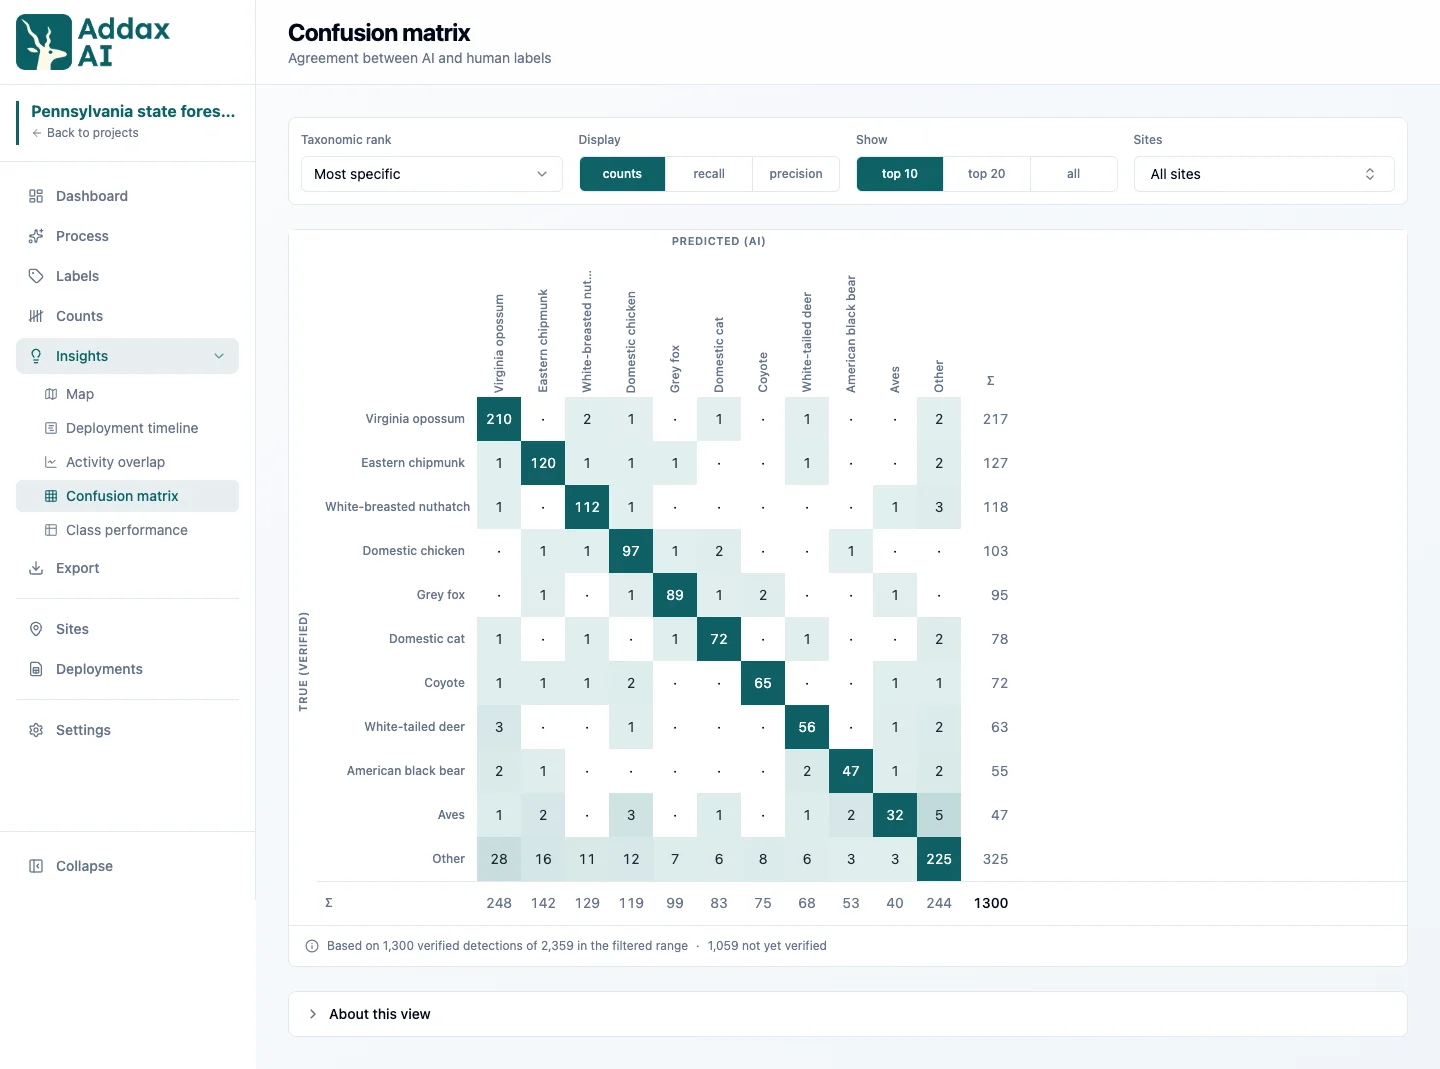
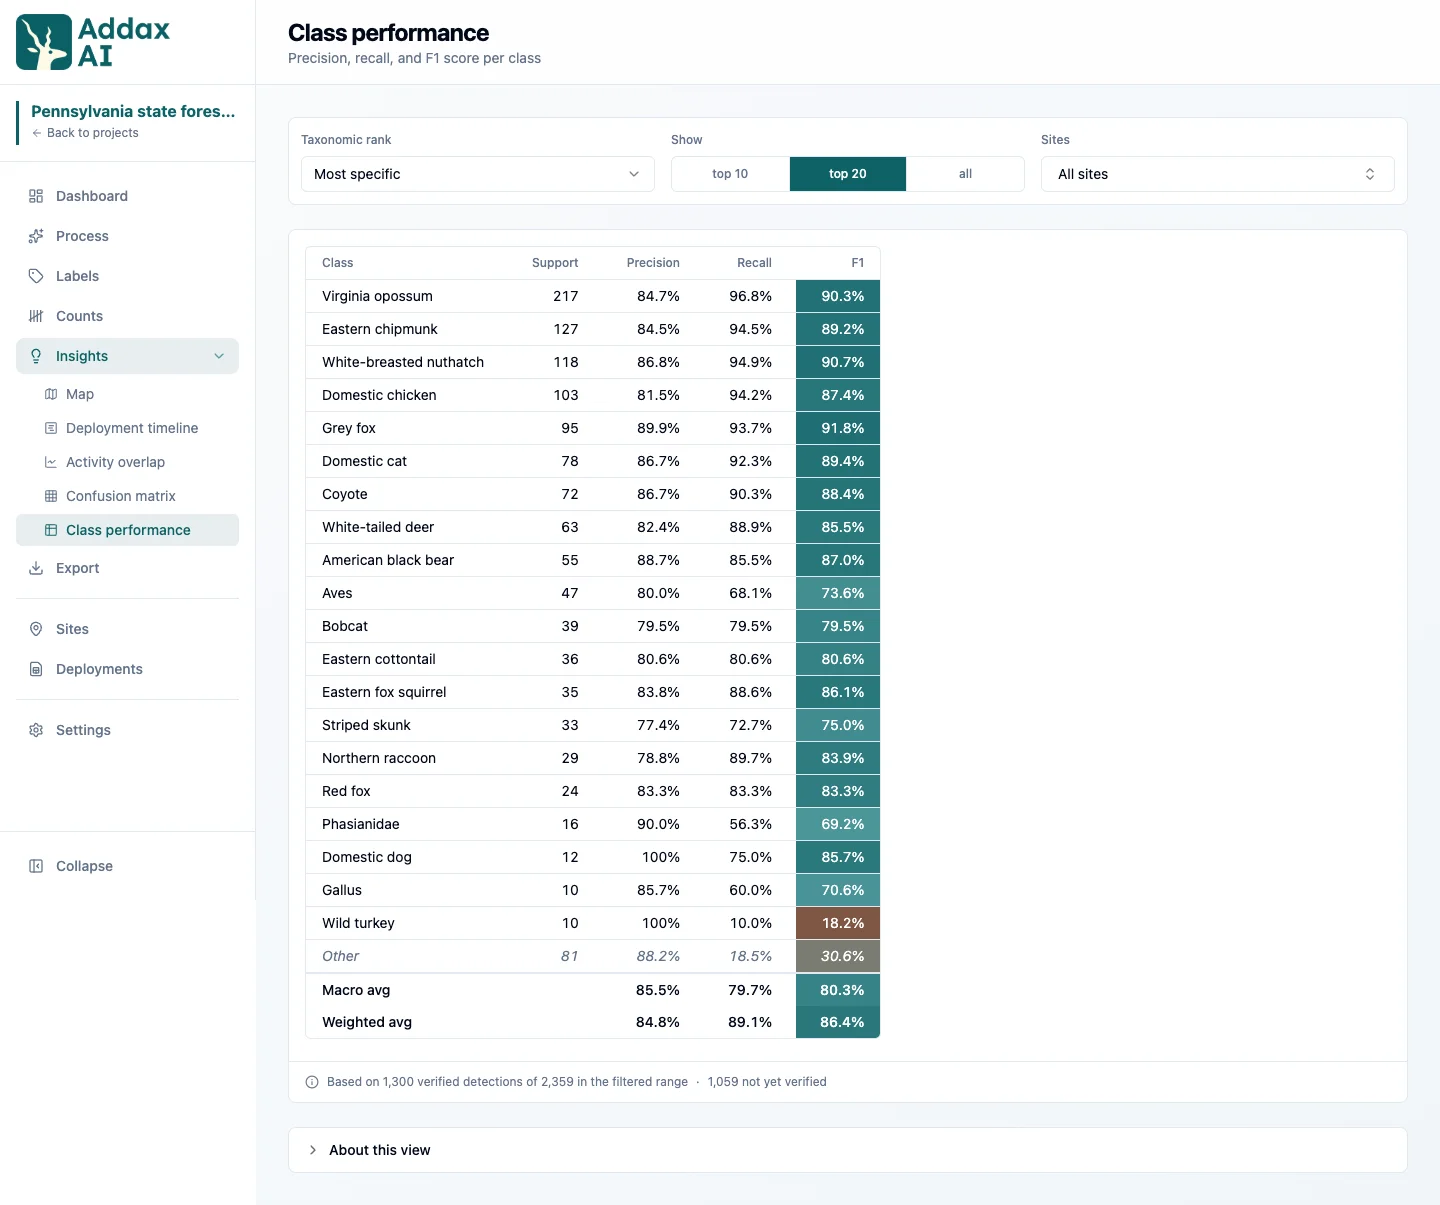
As you add data, the Dashboard and Insights fill in: species counts, activity patterns, trends, and a map of your sites.